在前面的文章已经详细讲解了MQTT、telegraf、influxDB等组件,这里要将三者之间的的关系理顺,并详细介绍配置及使用方法MQTT(mosquitto)->telegraf->influxDB
一、启动 mosquitto 服务

二、配置 telegraf 连接 influxDB、mosquitto
1、telegraf 采集MQTT数据,写入influxDB
# Configuration for telegraf agent
[agent]
  ## Default data collection interval for all inputs
  ##interval = "10s"
  interval = "5s"   #采集间隔5秒
  ## Rounds collection interval to 'interval'
  ## ie, if interval="10s" then always collect on :00, :10, :20, etc.
  round_interval = true

  ## Telegraf will send metrics to outputs in batches of at most
  ## metric_batch_size metrics.
  ## This controls the size of writes that Telegraf sends to output plugins.
  metric_batch_size = 1000

  ## Maximum number of unwritten metrics per output.  Increasing this value
  ## allows for longer periods of output downtime without dropping metrics at the
  ## cost of higher maximum memory usage.
  metric_buffer_limit = 10000

  ## Collection jitter is used to jitter the collection by a random amount.
  ## Each plugin will sleep for a random time within jitter before collecting.
  ## This can be used to avoid many plugins querying things like sysfs at the
  ## same time, which can have a measurable effect on the system.
  collection_jitter = "0s"

  ## Collection offset is used to shift the collection by the given amount.
  ## This can be be used to avoid many plugins querying constraint devices
  ## at the same time by manually scheduling them in time.
  # collection_offset = "0s"

  ## Default flushing interval for all outputs. Maximum flush_interval will be
  ## flush_interval + flush_jitter
  ##flush_interval = "10s"
  flush_interval = "5s"   #写入influxDB间隔5秒
  flush_jitter = "0s"
  precision = "0s"

# Configuration for sending metrics to InfluxDB
[[outputs.influxdb]]
  ## The full HTTP or UDP URL for your InfluxDB instance.
  ##
  ## Multiple URLs can be specified for a single cluster, only ONE of the
  ## urls will be written to each interval.
  # urls = ["unix:///var/run/influxdb.sock"]
  # urls = ["udp://127.0.0.1:8089"]
  urls = ["http://127.0.0.1:8086"]

  ## The target database for metrics; will be created as needed.
  ## For UDP url endpoint database needs to be configured on server side.
  database = "telegraf"
  ## Timeout for HTTP messages.
  timeout = "5s"

  ## HTTP Basic Auth
  username = "xxxx"    #连接influxDB数据库用户名
  password = "xxxx"    #连接influxDB数据库密码

# # Read metrics from MQTT topic(s)
[[inputs.mqtt_consumer]]
#   ## Broker URLs for the MQTT server or cluster.  To connect to multiple
#   ## clusters or standalone servers, use a separate plugin instance.
#   ##   example: servers = ["tcp://localhost:1883"]
#   ##            servers = ["ssl://localhost:1883"]
#   ##            servers = ["ws://localhost:1883"]
servers = ["tcp://127.0.0.1:1883"]
#   ## Topics that will be subscribed to.
#   topics = [
#     "telegraf/host01/cpu",
#     "telegraf/+/mem",
#     "sensors/#",
#   ]
topics = [
      "dev",
      "test",
    ]
#   # topic_fields = "_/_/_/temperature"
#   ## The message topic will be stored in a tag specified by this value.  If set
#   ## to the empty string no topic tag will be created.
#   # topic_tag = "topic"
#   ## QoS policy for messages
#   ##   0 = at most once
#   ##   1 = at least once
#   ##   2 = exactly once
#   ##
qos = 2
#   ## When using a QoS of 1 or 2, you should enable persistent_session to allow
#   ## resuming unacknowledged messages.
#   # qos = 0
#   ## Connection timeout for initial connection in seconds
#   # connection_timeout = "30s"
connection_timeout = "30s"
persistent_session = false
#   ## If unset, a random client ID will be generated.
#   # client_id = ""
#   ## Username and password to connect MQTT server.
#   # username = "telegraf"
username = "xxxx"   #连接MQTT的用户名
#   # password = "metricsmetricsmetricsmetrics"
password = "xxxx"   #连接MQTT的密码
#   ## Optional TLS Config
#   # tls_ca = "/etc/telegraf/ca.pem"
#   # tls_cert = "/etc/telegraf/cert.pem"
#   # tls_key = "/etc/telegraf/key.pem"
#   ## Use TLS but skip chain & host verification
#   # insecure_skip_verify = false
#   ## Data format to consume.
#   ## Each data format has its own unique set of configuration options, read
#   ## more about them here:
#   ## https://github.com/influxdata/telegraf/blob/master/docs/DATA_FORMATS_INPUT.md
#   data_format = "influx"
data_format = "value"
data_type = "string"
上例中,数据格式设置为 value,数据类型为 string ,模拟测试结果:

2、json 格式数据解析
可见我们将 json 字符串存入了 influxDB,如何完成解析呢?
https://github.com/influxdata/telegraf/blob/master/docs/DATA_FORMATS_INPUT.md
https://docs.influxdata.com/telegraf/v1.21/data_formats/input/json/
测试后发现,修改为以下参数
# # Read metrics from MQTT topic(s)
[[inputs.mqtt_consumer]]
......
data_format = "value"
data_type = "json"
tag_keys = [
  "id",
  "name",
  "collect_time",
]
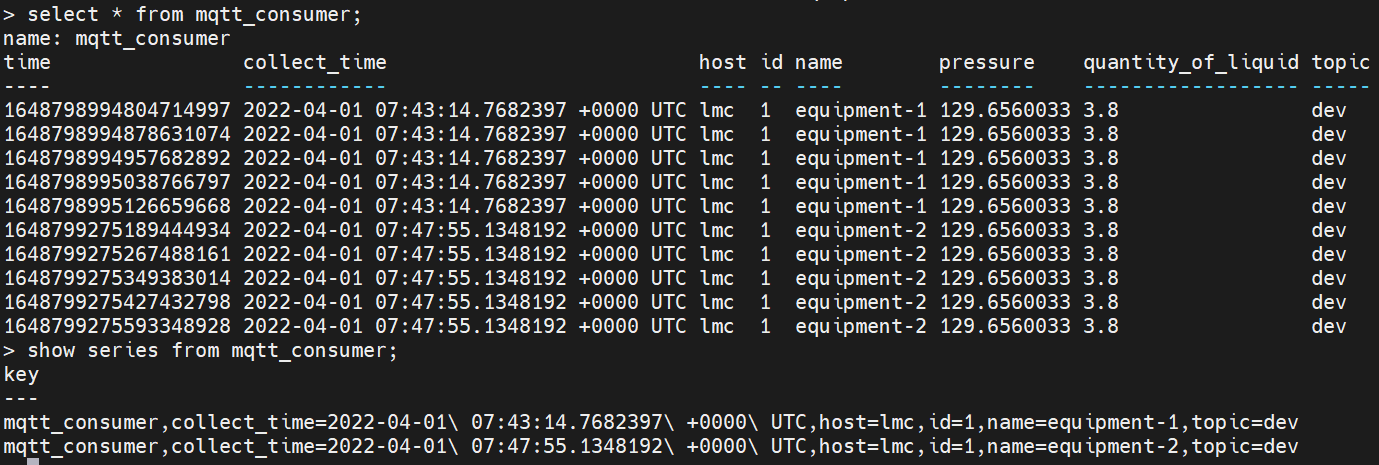
上例中,数据格式设置为 json,标签 tags 为 id、name、collect_time ,模拟测试结果:
# select * from mqtt_consumer;
# show series from mqtt_consumer;

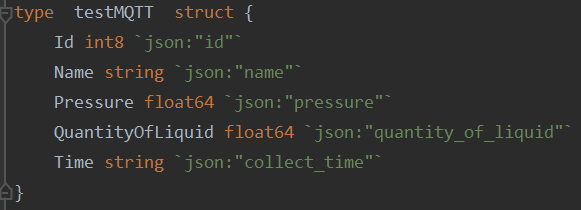
可见,该表中有 equipment-1、equipment-2 两个系列,也就是成图时有两条曲线。测试数据结构如下:

3、修改默认表 mqtt_consumer
测试后发现,修改为以下参数
# # Read metrics from MQTT topic(s)
[[inputs.mqtt_consumer]]
......
data_format = "value"
data_type = "json"
tag_keys = [
  "id",
  "name",
  "collect_time",
]
json_name_key = "measurement"
上例中,数据格式设置为 json_name_key 为表名取自哪个 json 字段,模拟测试结果:

可见,我们在 influxDB 中成功创建了 mqtt_test 表,并且插入了 5 条设备数据。测试数据结构如下:

其中,measurement 与 json_name_key 的设置值一一对应,当我们实例化赋值为 mqtt_test 时,该条数据插入时,就会创建 mqtt_test 表。